Army develops spray to kill coronavirus
News story
A novel disinfectant spray developed by the Army that can eliminate 99.99% of the Covid-19 virus will now be made available to the public and used by military personnel on the frontline as they support the battle against the virus.
Virusend can kill 99.99% of the pandemic strain of Covid-19 in under a minute.
Virusend will complement the existing range of protective products available currently in the UK that help keep people safe, with bottles available for the public to purchase online and in stores, with talks ongoing to up-scale the commercial rollout of the product.
Co-developed by innovation experts in the British Army, the Virusend spray formula is proven to be highly lethal against SARS-CoV-2, the pandemic strain of the coronavirus. Extensive tests by the Centre of Excellence for Infectious Disease Research and the Liverpool School for Tropical Medicine proved that Virusend kills 99.99% of the virus in under 1 minute.
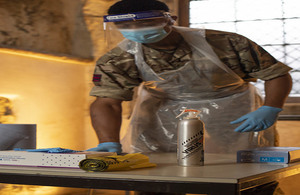
50,000 bottles of Virusend disinfectant are being deployed to personnel across the country who are working alongside the NHS at coronavirus testing stations as part of the military’s ongoing support to civil authorities. It is already being used at testing sites in Medway and Preston.
The spray’s quick kill-time makes it ideal for use on a variety of surfaces within high footfall areas such as the mass testing and vaccination sites. The disinfectant is also being tested for wider use in the NHS including within clinical environments.
The product was developed to provide the Army with enhanced protection in addition to a range of PPE and social distancing measures whilst operating Covid testing facilities
Lt Col James Cackett, CO 35 Engineer Regiment (EOD&S) and commanding the Medway Resilience Unit said:
The troops who are now working in Medway have welcomed the deployment of this additional force protection measure. Virusend is proving easy to use and will help us keep our work areas safe for everyone.
Lt Col Christopher Warhurst, Virusend Project Manager, Manoeuvre Support Plans, said:
I am truly privileged to be at the centre of this amazing partnership and work with such talented and dedicated people. What started out as a good idea has developed into an amazing product that has the potential to have a real impact against the virus. The Army is proud to have been involved in this incredible project.
Virusend boasts a quick kill time and high lethality to the Covid-19 virus. Virusend is supplied through the ‘Anyway Spray’ bottle, a system developed by Pritchard Spray Technology Ltd.
The innovative bottle covers a wide surface area and can be used upside-down, eliminating any wastage. The bottle uses compressed air instead of flammable gasses and is also fully recyclable and re-useable.
Michael Pritchard MBE, CEO Pritchard Spray Technology Ltd. said:
This pioneering spray will change the way we combat this and all future pandemics. This has been a truly unique collaboration that showcases what we the United Kingdom can achieve. We want to give the UK the tools it needs to defeat coronavirus and get back on its feet as soon as possible.
Published 16 December 2020